You get the text alert at 7:14 AM. A Ruff has been spotted at the sewage ponds just outside town. Your coffee goes cold. You grab your binoculars, throw on boots, and hit the road. By the time you arrive, two other birders are already walking back to their cars, smiling. They saw it. You scan the mudflats for forty five minutes. Nothing. The bird moved on. That feeling of being one step behind is frustrating, but it does not have to be your story.
Mastering eBird rare bird alerts is about speed, precision, and knowing how the system works. This guide covers setting up custom alert zones, filtering by rarity level, and reading between the lines of a sighting report. You will learn when to drop everything and go, when to wait for more details, and how to combine alerts with habitat knowledge to predict where a vagrant will move next. Stop chasing rumors. Start catching rarities.
Why Most Birders Miss the Window
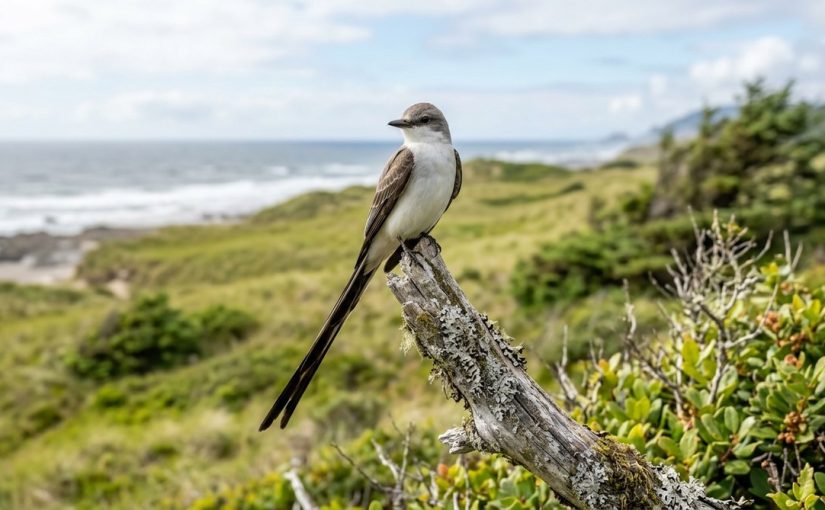
The difference between seeing a rare bird and hearing about it from someone else often comes down to minutes. A Fork-tailed Flycatcher might linger in an Oregon field for just a few hours. A Blue-footed Booby blown inland after a Pacific storm could rest on a reservoir for one afternoon before moving on. By the time a general eBird alert reaches your inbox, the bird could already be gone.
The default eBird alert system works well for casual birders. It sends a daily digest of unusual sightings from your region. That is fine for planning a weekend trip. It is useless for chasing a vagrant that might leave before lunch. You need a different approach. You need real time notifications, narrow geographic filters, and a strategy for interpreting each report before you waste gas on a false lead.
Setting Up Your Custom Alert Zones
Your first step is to stop relying on the default “Rare Bird Alerts” page and build your own notification system inside eBird. Here is how to do it.
- Log into your eBird account and navigate to “My eBird” then “Alerts.” Click the button to create a new alert. Give it a name that means something to you, like “Home Patch Alerts” or “Coastal Vagrants.”
- Set your region with precision. Do not choose a whole county or state. Pick a radius of 10 to 25 miles around your most frequent birding spots. For coastal birders, set multiple alerts: one for your local patch, one for the nearest hotspot, and one for a broader region that covers inland water bodies where storm driven birds might land.
- Choose your rarity threshold. eBird lets you filter by “Species on your target list,” “Rare species,” or “All species.” For chasing vagrants, select “Rare species.” That filters out the daily American Robins and focuses your attention on the birds that matter.
- Select your delivery method. Get alerts by email and by push notification through the eBird mobile app. Turn off the daily digest for this alert. You want instant delivery only.
- Save and test. Create a test alert by temporarily setting the rarity threshold to “All species” and see if the notifications come through on your phone. Then switch it back to “Rare species.”
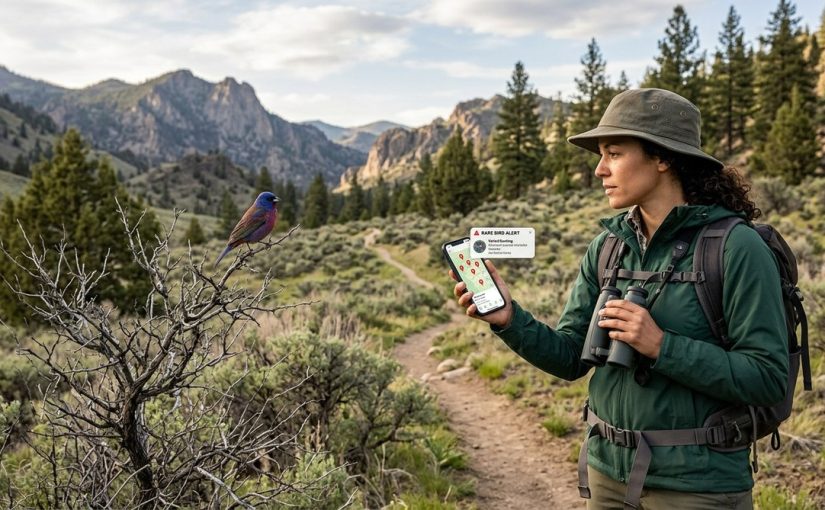
Once your alerts are live, you will receive a notification within minutes of a rare bird being reported. That is your starting gun.
Reading the Report Like a Detective
Not every alert is worth chasing. Some reports are incomplete, some are misidentified, and some arrive too late. You need to scan the details and decide fast.
- Check the report time. If the sighting was submitted three hours ago and the bird was seen at dawn, the odds drop. If it was submitted fifteen minutes ago, move.
- Look at the observer’s history. A report from a birder with 500+ complete checklists and a history of accurate IDs carries more weight than a first time user. You can click on the observer’s name in eBird to see their profile.
- Read the comments. Did the observer note that the bird was actively feeding? That suggests it might stay for a while. Did they say it flew north? That gives you a direction to search.
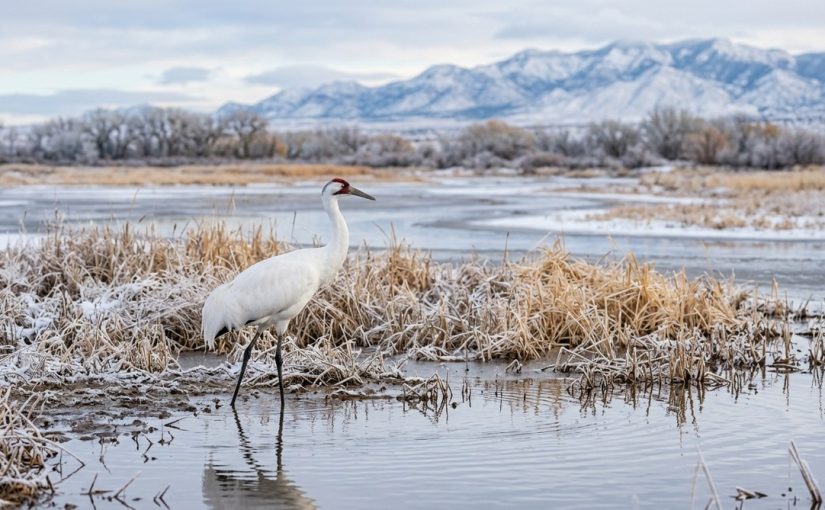
- Check the species’ typical behavior. A Ruff often stays in one wetland for several days. A vagrant warbler might move through a single tree in ten minutes. Know the habits of the bird you are chasing.
A good rule of thumb: if the alert is for a shorebird or a waterfowl species, you have a longer window. If it is for a passerine, especially during migration, you need to go immediately.
Timing Your Departure
When you get a promising alert, do not rush out the door without a plan. Take sixty seconds to do three things.
First, pull up the location on Google Maps or your preferred navigation app. Check for access points. Some sewage ponds require a key. Some state parks have entry fees. Some fields are on private land. Knowing this before you drive saves you from arriving at a locked gate.
Second, check the weather. A strong wind might push a vagrant into cover. Rain might make it hunker down. Clear skies after a storm often mean the bird will resume migration.
Third, grab your gear. That means your camera or phone for documentation, your field guide or a bird ID app, and a notebook. If you see the bird, you need to document it properly. Our guide on how to document and report your rare bird sighting like a pro covers the specific photo angles and audio recordings that reviewers need.
What to Do When You Arrive
You park the car. Now what? Do not walk straight to the exact spot where the bird was reported. That might flush it. Instead, scan the area from a distance. Use your binoculars to check likely perches, mudflats, or water edges. Move slowly. Talk quietly if you are with a partner.
If you do not see the bird in the first fifteen minutes, expand your search in a logical pattern. Rare birds do not always read the eBird map. A Ruff reported on the east pond might have moved to the west pond. A vagrant warbler might have shifted fifty yards down the treeline.
Be respectful of other birders. If someone else is already there, ask if they have seen the bird. Share information. The birding community works best when we help each other.
Common Mistakes That Cost You the Sighting
Even experienced birders make these errors. Avoid them and your success rate will climb.
| Mistake | Why It Hurts | The Fix |
|---|---|---|
| Relying on daily digest alerts | You get the news hours late, sometimes the next day. | Switch to instant push notifications for rare species only. |
| Ignoring the observer’s credibility | A misidentified bird sends you on a wild goose chase. | Check the observer’s profile before you drive. |
| Searching the wrong habitat | A shorebird alert in a grassland means the report might be wrong or the bird moved. | Read the comments and know the species’ preferred habitat. |
| Arriving too loud and fast | You flush the bird before you even see it. | Approach slowly, scan from a distance, and move quietly. |
| Not documenting when you see it | You cannot submit a credible report without evidence. | Take photos or record audio even if you are sure of the ID. |
Combining Alerts with Habitat Knowledge
eBird rare bird alerts tell you where a bird was. They do not tell you where it is going. That part is up to you.
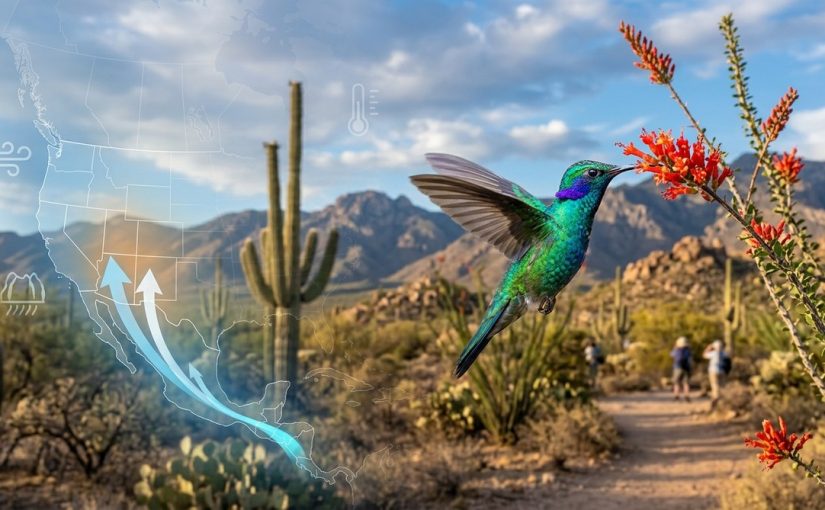
If you know that a storm system pushed pelagic birds inland, you can predict which reservoirs or large lakes will attract them. If you know that a cold front in the Pacific Northwest often brings Siberian vagrants, you can check coastal headlands and berry patches. The alert is just the trigger. Your understanding of local geography and weather patterns is what puts the bird in your binoculars.
For example, a report of a Slaty-backed Gull on a California beach might seem random. But if you know that these gulls often associate with gull roosts on jetties, you can check the nearest jetty at low tide. The alert gives you a starting point. Your knowledge gives you the next move.
When to Trust Your Gut
Sometimes an alert seems off. The location does not make sense. The time of year is wrong for that species. The observer has no prior history. In those cases, do not waste your time. Wait for a second report. If another birder confirms the sighting, then go.
On the other hand, sometimes an alert seems too good to be true and it is real. A first state record can come from a random backyard. Do not dismiss an alert just because the location is unusual. Use your judgment. If the habitat looks right and the observer seems credible, take the chance.
Building a Network Beyond the App
eBird alerts are powerful, but they work best when combined with local birding networks. Join your state or county rare bird alert group on social media. Subscribe to local listservs. Follow active birders on platforms like Instagram or WhatsApp groups. Often, a birder will post a photo to a local group before they submit their eBird checklist. That extra five minutes can be the difference.
You should also contribute your own sightings. When you find a rare bird, submit your checklist immediately. Include a photo if you can. That helps the next birder, and it builds goodwill in the community. The more accurate and timely data we all share, the better the system works for everyone.
Your 2026 Rare Bird Toolkit
As of 2026, the tools available to birders are better than ever. The eBird mobile app now allows offline checklist submission, which is critical when you are in a remote canyon with no cell service. The alerts system has improved filtering options, letting you set alerts for specific species or groups like “all vagrant warblers” or “rare gulls.”
Pair your eBird alerts with a weather radar app. You can track storm fronts in real time and predict where displaced birds might land. Combine that with a good mapping app that shows public land boundaries, and you have a serious advantage.
For a full rundown of the best apps and resources, check out our guide on rare bird alerts: which apps and resources actually work best. It compares eBird with other platforms and tells you which ones are worth your time.
The Art of the Follow Up
You saw the bird. You got the photos. Now what? Do not just leave. Watch the bird for a few more minutes. Note its behavior. Is it feeding? Is it resting? Is it interacting with other birds? That information is valuable for the next birder and for the scientific record.
If the bird is still present when you leave, post an update to the same eBird hotspot or location. Write a brief comment: “Still present at 10:30 AM, foraging on the east shore.” That gives the next person confidence to make the drive.
If the bird has moved on, say that too. “Searched for 45 minutes with no sign. Bird may have moved north.” That saves someone else from wasting their morning.
How to Handle a Miss
You will miss birds. Everyone does. The Ruff that was there at dawn is gone by noon. The vagrant warbler that someone saw yesterday did not stick around. That is part of the game. Do not beat yourself up.
Instead, analyze what went wrong. Was the alert too slow? Adjust your notification settings. Did you arrive too late? Leave earlier next time. Did you search the wrong spot? Study the habitat more carefully. Each miss is a lesson that makes you better for the next one.
Staying Ethical While Chasing Rarities
The thrill of a rare bird can make us forget our manners. Do not trespass on private land without permission. Do not play recordings to lure a bird out of cover. Do not crowd a bird so closely that it stops feeding or becomes stressed. A single vagrant might be exhausted from migration. Your presence could push it into danger.
Follow the American Birding Association’s code of ethics. Respect other birders, respect the land, and respect the birds. A rare bird sighting is a privilege, not a right.
Putting It All Together
You have the alerts set up. You know how to read a report. You have a plan for when you arrive. Now it is time to put it into practice. The next time your phone buzzes with an eBird rare bird alert, you will not hesitate. You will check the details, grab your gear, and head out with confidence.
Maybe it is a Fork-tailed Flycatcher in Oregon. Maybe it is a Siberian vagrant on the Washington coast. Maybe it is a life bird you have been chasing for years. Whatever it is, you will be ready.
Get out there. The birds are waiting, but they will not wait long.